Programming Languages Matlab 3101 - Class 3
3/26/08, Instructor: Blake Shaw
Contents
Short class because of Quiz
Review
cells, strings, avoiding loops, creating indexes
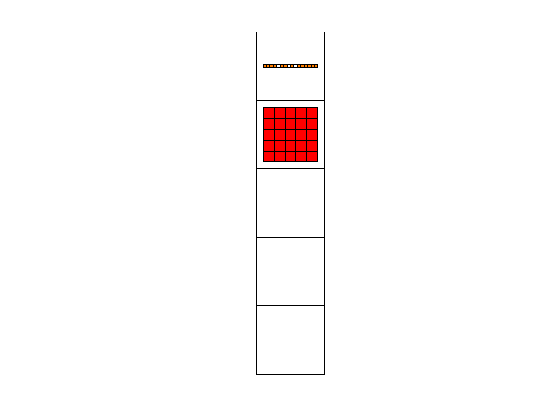
s = 'hello'

x = double(s)

char(x + 1)

strfind('hello my name is blake', 'name')

A = cell(5, 1);

A{1} = 'this is a string';
A{2} = rand(5, 5);


figure(1);
cellplot(A);
s =

hello


x =

   104   101   108   108   111


ans =

ifmmp


ans =

    10
a = round(10*rand(10, 1));
b = round(10*rand(10, 10));
a

circshift(a, 2)

b
a =

     9
     1
    10
     6
     8
     6
     6
     3
     1
     7


ans =

     1
     7
     9
     1
    10
     6
     8
     6
     6
     3


b =

     8     5     5     5     7     7     5     9     3     7
     8    10     2     1     1     9     8     0    10     6
     5    10     7     0     5     9     9    10     2     2
     4     1     6     1    10     9     6     2     5     6
     5     9     8     2     3     7     9     4     4     2
     3     0     1     5     5     6     5     4     5     3
     2     7     4     6     8     4     3     8     0     6
     6     7     2     5     3     1     1     5    10     8
     0     1     6     6     7     3     2     6     1     0
     7     8     1     3     9     5     3     7     5     4
sqrt(sum((b - repmat(a, 1, 10)).^2))
ans =

  Columns 1 through 6

   11.0905   13.3041   10.8167   14.9332   10.7238    9.7468

  Columns 7 through 10

    9.8995    8.3666   16.9706   13.1529
A = rand(10, 10);
A

A(A > 0.7) = 0;

A

[i, j] = find(A > 0.3)
A =

  Columns 1 through 6

    0.7995    0.2917    0.4413    0.0223    0.2857    0.2740
    0.1596    0.7565    0.4707    0.1483    0.7895    0.5873
    0.3124    0.1037    0.8814    0.4757    0.2054    0.2684
    0.6311    0.2274    0.6451    0.8780    0.4298    0.7843
    0.5910    0.4879    0.1462    0.8632    0.6288    0.1486
    0.0545    0.8733    0.2124    0.9961    0.5593    0.7733
    0.8695    0.5791    0.1260    0.7573    0.2463    0.5199
    0.7280    0.4213    0.5361    0.8858    0.6565    0.5867
    0.0166    0.8133    0.8399    0.3687    0.1323    0.5190
    0.7441    0.6953    0.2399    0.7160    0.5134    0.1406

  Columns 7 through 10

    0.3159    0.8659    0.4579    0.8151
    0.8613    0.2196    0.6478    0.4857
    0.4334    0.3012    0.9789    0.1162
    0.0595    0.5871    0.4214    0.1434
    0.8859    0.9020    0.9758    0.7847
    0.2560    0.5237    0.5186    0.2689
    0.2876    0.6688    0.5429    0.5568
    0.2239    0.6769    0.3791    0.1357
    0.5912    0.9529    0.8492    0.4245
    0.5643    0.6239    0.5456    0.0576


A =

  Columns 1 through 6

         0    0.2917    0.4413    0.0223    0.2857    0.2740
    0.1596         0    0.4707    0.1483         0    0.5873
    0.3124    0.1037         0    0.4757    0.2054    0.2684
    0.6311    0.2274    0.6451         0    0.4298         0
    0.5910    0.4879    0.1462         0    0.6288    0.1486
    0.0545         0    0.2124         0    0.5593         0
         0    0.5791    0.1260         0    0.2463    0.5199
         0    0.4213    0.5361         0    0.6565    0.5867
    0.0166         0         0    0.3687    0.1323    0.5190
         0    0.6953    0.2399         0    0.5134    0.1406

  Columns 7 through 10

    0.3159         0    0.4579         0
         0    0.2196    0.6478    0.4857
    0.4334    0.3012         0    0.1162
    0.0595    0.5871    0.4214    0.1434
         0         0         0         0
    0.2560    0.5237    0.5186    0.2689
    0.2876    0.6688    0.5429    0.5568
    0.2239    0.6769    0.3791    0.1357
    0.5912         0         0    0.4245
    0.5643    0.6239    0.5456    0.0576


i =

     3
     4
     5
     5
     7
     8
    10
     1
     2
     4
     8
     3
     9
     4
     5
     6
     8
    10
     2
     7
     8
     9
     1
     3
     9
    10
     3
     4
     6
     7
     8
    10
     1
     2
     4
     6
     7
     8
    10
     2
     7
     9


j =

     1
     1
     1
     2
     2
     2
     2
     3
     3
     3
     3
     4
     4
     5
     5
     5
     5
     5
     6
     6
     6
     6
     7
     7
     7
     7
     8
     8
     8
     8
     8
     8
     9
     9
     9
     9
     9
     9
     9
    10
    10
    10
3:2:54

linspace(-10, 10, 56)

logspace(-1, 1, 10)
ans =

  Columns 1 through 11

     3     5     7     9    11    13    15    17    19    21    23

  Columns 12 through 22

    25    27    29    31    33    35    37    39    41    43    45

  Columns 23 through 26

    47    49    51    53


ans =

  Columns 1 through 6

  -10.0000   -9.6364   -9.2727   -8.9091   -8.5455   -8.1818

  Columns 7 through 12

   -7.8182   -7.4545   -7.0909   -6.7273   -6.3636   -6.0000

  Columns 13 through 18

   -5.6364   -5.2727   -4.9091   -4.5455   -4.1818   -3.8182

  Columns 19 through 24

   -3.4545   -3.0909   -2.7273   -2.3636   -2.0000   -1.6364

  Columns 25 through 30

   -1.2727   -0.9091   -0.5455   -0.1818    0.1818    0.5455

  Columns 31 through 36

    0.9091    1.2727    1.6364    2.0000    2.3636    2.7273

  Columns 37 through 42

    3.0909    3.4545    3.8182    4.1818    4.5455    4.9091

  Columns 43 through 48

    5.2727    5.6364    6.0000    6.3636    6.7273    7.0909

  Columns 49 through 54

    7.4545    7.8182    8.1818    8.5455    8.9091    9.2727

  Columns 55 through 56

    9.6364   10.0000


ans =

  Columns 1 through 6

    0.1000    0.1668    0.2783    0.4642    0.7743    1.2915

  Columns 7 through 10

    2.1544    3.5938    5.9948   10.0000
Figures
figure, clf, gcf, hold, savesas
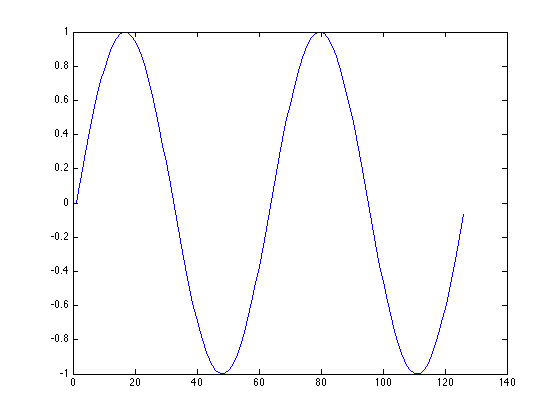
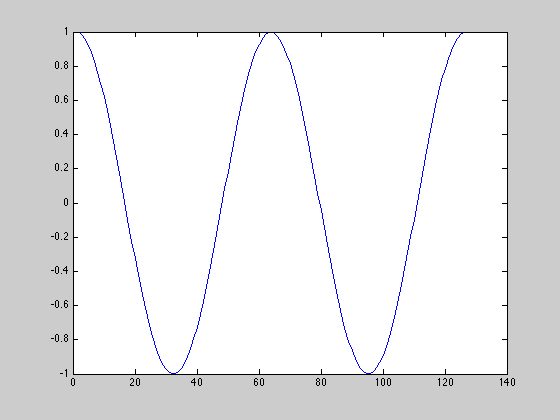
figure(1);
plot(sin(-2*pi:0.1:2*pi));


figure(2);
plot(cos(-2*pi:0.1:2*pi));

gcf
ans =

     2
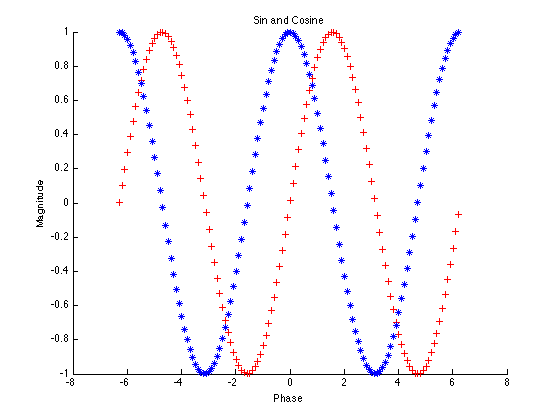
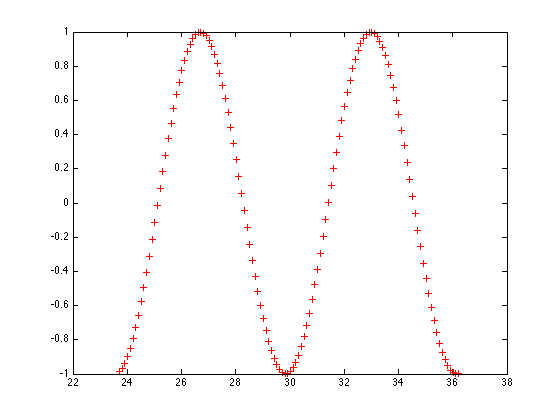
figure(1);
clf;

hold on;
plot(-2*pi:0.1:2*pi, sin(-2*pi:0.1:2*pi), 'r+');
plot(-2*pi:0.1:2*pi, cos(-2*pi:0.1:2*pi), '*');
title('Sin and Cosine');
ylabel('Magnitude');
xlabel('Phase');
hold off;


saveas(gcf, 'myFirstFigure.png');
Simple animation
drawnow
figure(1);
clf;

for i=0:0.1:30
    x = -2*pi:0.1:2*pi;
    x = x+i;

    plot(x, sin(x), 'r+');
    drawnow;
    %saveas(gcf, sprintf('myFirstFigure%d.png', i));
end
Images
imagesc, importdata, imread, imwrite
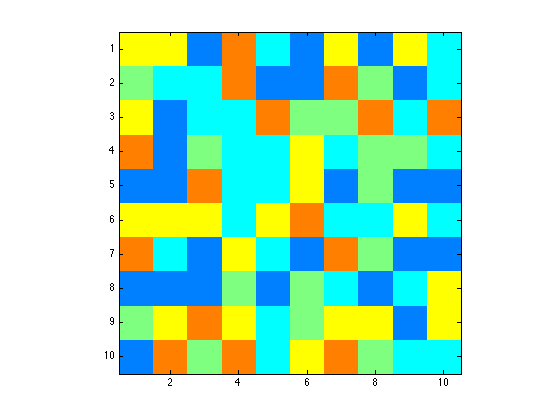
figure(1); clf;
X = rand(10, 10);
imagesc(X); axis image;
colormap('jet');
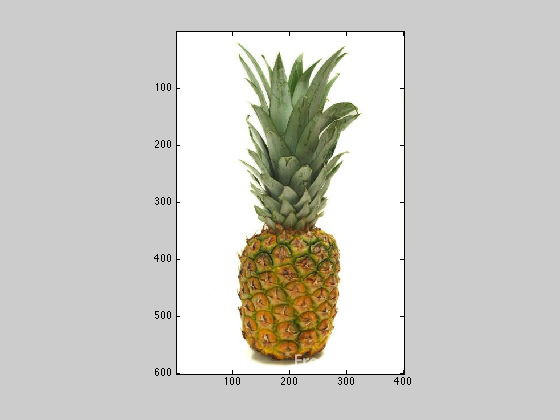
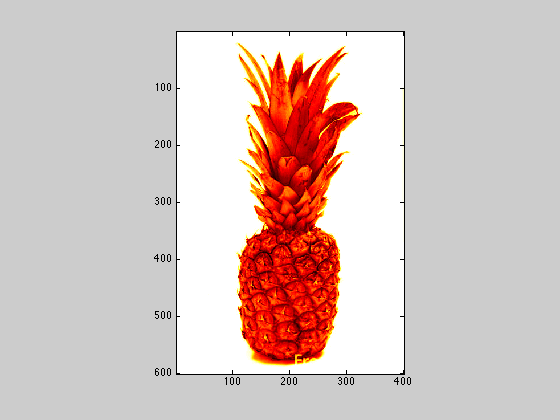
X = importdata('pine.jpg');

figure(2); clf;
imagesc(X); axis image;

Y = mean(X, 3);

figure(3); clf;
imagesc(Y); axis image;
colormap('hot');
X = imread('pine.jpg');
Y = uint8(255);
figure(3);
saveas(gcf, 'pineHot.jpg');
imwrite(Y, 'pineHot2.png', 'png');

%% figure(1); clf; X = rand(10, 10); imagesc(X); axis image; colormap('jet');
for i=1:10 [x, y] = ginput(1) x = round(x); y = round(y);
   X(y, x) = 0;
   imagesc(X); axis image;
   colormap('jet');
end
%% User input % ginput, input
x = input('What is the temperature today? ');
disp(sprintf('The temp is %d', x));
%%
s = input('How are you doing today? ', 's');
s
Colormaps and different kinds of images
colormap
Convolution
conv2, xcorr2