HW2 - 3101 Matlab -- (INSERT NAME and UNI HERE)
Due 11:59pm on Tuesday, March 25th, 2008
Contents
Goals
Start using matlab as a simple scripting language
Directions
Please fill in your name at the top of this page and write your answers under their corresponding question. When you are done, publish this file to html using File > Publish To HTML (or the command publish('hw1.m', 'html') and create a new zip file that is labeled with your UNI and homework number (eg. bs2018-hw1.zip), that contains this original m file, and the html directory created from publishing the file. Email this file to cs3101@gmail.com, making sure to include your name, and uni in the subject.
Note
When I say display a variable I mean display it so the output is labeled with the variable name, don't use disp, just leave off the semicolon from the end of the command.
Help
If you get stuck, type the command doc to pull up the documentation window, from there it's easy to search for any other commands or functions you might want to use...
Problem 1 - Fibonacci numbers and the golden ratio
Wikipedia: Fibonacci Number Use a for loop to compute the first 1000 Fibonacci numbers, and store them in a variable called f. only display the first 10 elements, make sure not to display anything while you are looping (use a semicolon)
f(1) = 1;
f(2) = 1;
for i=3:1000
    f(i) = f(i-1) + f(i-2);
end

f(1:10)
ans =

     1     1     2     3     5     8    13    21    34    55
1.2
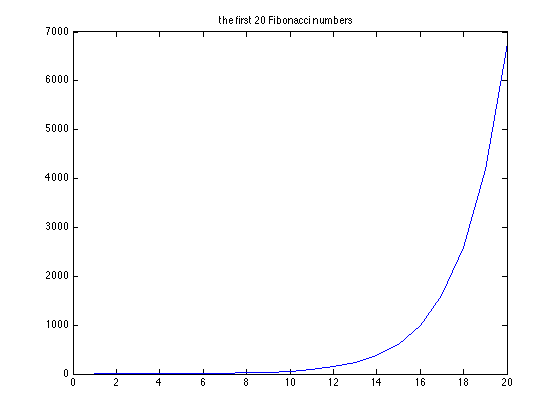
plot the first 20 Fibonacci numbers, and title your plot.
plot(f(1:20));
title('the first 20 Fibonacci numbers');
1.3
(http://en.wikipedia.org/wiki/Golden_ratio) The golden ratio (also known as phi) is an irrational number that can be found throughout science, art and architecture since the renaissance... we know that phi is equal to (1 + sqrt(5)) / 2, however it is also easily expressed as the ratio between two successive Fibonacci numbers (weird... i know...). use a while loop to find the first two fibonacci numbers whose ratio approximates phi with an error less then 0.001, and print out only those two successive Fibonacci numbers... note: the while loop should terminate after it has found the first set of Fibonacci numbers whose ratio yields an error less then 0.0001
phi = (1 + sqrt(5))/2;

i = 1;
error = inf;
while error >= 0.0001
    phiapprox = f(i+1)/f(i);
    error = abs(phi - phiapprox);
    i = i+1;
end

f(i+1)
f(i)
ans =

   233


ans =

   144
1.5
display the exact phi, then display your approximation for phi calculated above, and then display the absolute value of their difference
phi
phiapprox

abs(phi - phiapprox)
phi =

    1.6180


phiapprox =

    1.6180


ans =

   5.6461e-05
1.5
change the display format to long and then display the exact phi, the approximate phi, and their difference
format('long');

phi
phiapprox

abs(phi - phiapprox)
phi =

   1.618033988749895


phiapprox =

   1.617977528089888


ans =

     5.646066000730698e-05
1.6
change the display format back to short (the default)
format('short');
Problem 2 - Exploring the julia set fractals
(http://en.wikipedia.org/wiki/Julia_set) Julia set fractals are very interesting, and beautiful; they are also not too hard to create in matlab. first we start with a grid of equally spaced complex numbers, where the real components vary from -2 to 2, and the imaginary components vary from -2i to 2i. then for each number in this grid, we recursively apply a mathematical function to it many times and see how many times before the complex number becomes bigger then some cutoff value... that count of how many iterations it takes to blow up determines the color of that one pixel of the fractal
2.1
first lets start with a matrix of all zeros, so let's set N equal to 10, and make a new matrix F which is NxN and contains all zeros
N = 10;
F = zeros(N, N);
2.2
create a variable called x which contains N numbers that are equally spaced between -2 and 2
x = -2:((2+2)/(N-1)):2
x =

  Columns 1 through 9

   -2.0000   -1.5556   -1.1111   -0.6667   -0.2222    0.2222    0.6667    1.1111    1.5556

  Column 10

    2.0000
2.3
create a variable called z0 which is a matrix of size NxN, such that element i,j of z0 should equal x(i) + sqrt(-1)*x(j). When we are done filling z0, it should contain equally spaced complex numbers such that the real component goes from -2 to 2 horizontally, and imaginary component goes from -2i to 2i vertically. Display z0. (Extra credit, if you can make z0 using only 1 line, no loops or semicolons)
z0 = zeros(N, N);
for i=1:N
    for j=1:N
        z0(i, j) = x(i) + sqrt(-1)*x(j);
    end
end
z0

% extra credit solution:
z0 = repmat(x, N, 1) + (sqrt(-1) * repmat(x', 1, N));
z0 =

  Columns 1 through 4

  -2.0000 - 2.0000i  -2.0000 - 1.5556i  -2.0000 - 1.1111i  -2.0000 - 0.6667i
  -1.5556 - 2.0000i  -1.5556 - 1.5556i  -1.5556 - 1.1111i  -1.5556 - 0.6667i
  -1.1111 - 2.0000i  -1.1111 - 1.5556i  -1.1111 - 1.1111i  -1.1111 - 0.6667i
  -0.6667 - 2.0000i  -0.6667 - 1.5556i  -0.6667 - 1.1111i  -0.6667 - 0.6667i
  -0.2222 - 2.0000i  -0.2222 - 1.5556i  -0.2222 - 1.1111i  -0.2222 - 0.6667i
   0.2222 - 2.0000i   0.2222 - 1.5556i   0.2222 - 1.1111i   0.2222 - 0.6667i
   0.6667 - 2.0000i   0.6667 - 1.5556i   0.6667 - 1.1111i   0.6667 - 0.6667i
   1.1111 - 2.0000i   1.1111 - 1.5556i   1.1111 - 1.1111i   1.1111 - 0.6667i
   1.5556 - 2.0000i   1.5556 - 1.5556i   1.5556 - 1.1111i   1.5556 - 0.6667i
   2.0000 - 2.0000i   2.0000 - 1.5556i   2.0000 - 1.1111i   2.0000 - 0.6667i

  Columns 5 through 8

  -2.0000 - 0.2222i  -2.0000 + 0.2222i  -2.0000 + 0.6667i  -2.0000 + 1.1111i
  -1.5556 - 0.2222i  -1.5556 + 0.2222i  -1.5556 + 0.6667i  -1.5556 + 1.1111i
  -1.1111 - 0.2222i  -1.1111 + 0.2222i  -1.1111 + 0.6667i  -1.1111 + 1.1111i
  -0.6667 - 0.2222i  -0.6667 + 0.2222i  -0.6667 + 0.6667i  -0.6667 + 1.1111i
  -0.2222 - 0.2222i  -0.2222 + 0.2222i  -0.2222 + 0.6667i  -0.2222 + 1.1111i
   0.2222 - 0.2222i   0.2222 + 0.2222i   0.2222 + 0.6667i   0.2222 + 1.1111i
   0.6667 - 0.2222i   0.6667 + 0.2222i   0.6667 + 0.6667i   0.6667 + 1.1111i
   1.1111 - 0.2222i   1.1111 + 0.2222i   1.1111 + 0.6667i   1.1111 + 1.1111i
   1.5556 - 0.2222i   1.5556 + 0.2222i   1.5556 + 0.6667i   1.5556 + 1.1111i
   2.0000 - 0.2222i   2.0000 + 0.2222i   2.0000 + 0.6667i   2.0000 + 1.1111i

  Columns 9 through 10

  -2.0000 + 1.5556i  -2.0000 + 2.0000i
  -1.5556 + 1.5556i  -1.5556 + 2.0000i
  -1.1111 + 1.5556i  -1.1111 + 2.0000i
  -0.6667 + 1.5556i  -0.6667 + 2.0000i
  -0.2222 + 1.5556i  -0.2222 + 2.0000i
   0.2222 + 1.5556i   0.2222 + 2.0000i
   0.6667 + 1.5556i   0.6667 + 2.0000i
   1.1111 + 1.5556i   1.1111 + 2.0000i
   1.5556 + 1.5556i   1.5556 + 2.0000i
   2.0000 + 1.5556i   2.0000 + 2.0000i
2.4
for each element in F, F(i,j), get the initial value of z from the matrix z0 and then use a while loop and a counter variable to count how many iterations of applying the function z = z^2 + c causes the absolute value of z to become bigger then the variable blowup. After you are done, F(i,j) should equal the number of times you had to apply z = z^2 + c repeatedly, before abs(z) gets bigger then the blowup parameter. Note: make sure to put a limit on the number of times the inner while loop can iterate if abs(z) doesn't blowup.
c=0.285+0.01i
blowup = 200;
maxiter = 200;

for i=1:N
    for j=1:N
        z = z0(i, j);
        counter=0;
        while abs(z)<blowup && counter < maxiter
            z = z^2 + c;
            counter = counter + 1;
        end
        F(i, j) = counter;
    end
end
c =

   0.2850 + 0.0100i
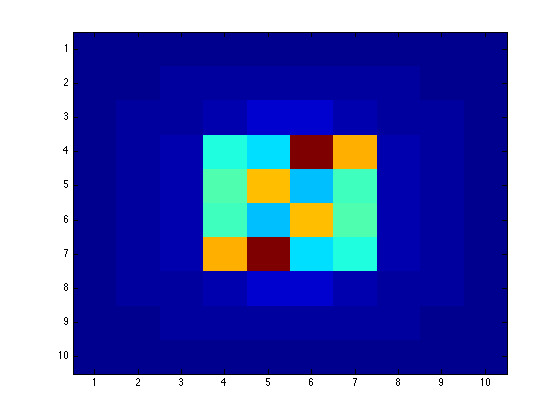
2.5
display F, and then plot it using imagesc. make sure the axes are set to image
F
figure(1); imagesc(F);
F =

     3     3     3     3     3     3     3     3     3     3
     3     3     4     4     4     4     4     4     3     3
     3     4     4     5     7     7     5     4     4     3
     3     4     5    24    21    56    40     5     4     3
     3     4     5    27    39    19    26     5     4     3
     3     4     5    26    19    39    27     5     4     3
     3     4     5    40    56    21    24     5     4     3
     3     4     4     5     7     7     5     4     4     3
     3     3     4     4     4     4     4     4     3     3
     3     3     3     3     3     3     3     3     3     3
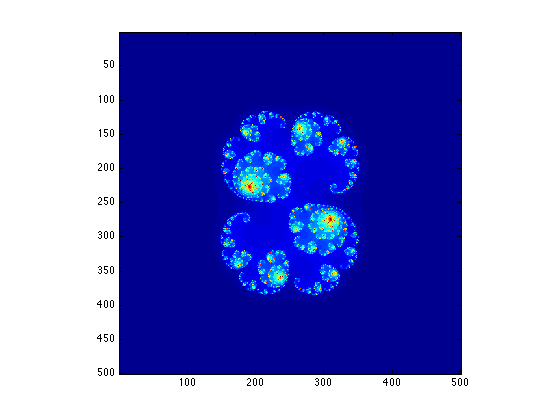
2.6
Collect all the code from this problem, and put it together as 1 chunk of code below and set N to be much bigger, like between 100 and 500
disp('initiializing variables...');
N = 500;
maxiter = 200;
blowup = 200;
scale = 2;

F = zeros(N, N);

%c = rand + rand*sqrt(-1);
c=0.285+0.01i


x = -scale:(2*scale/(N-1)):scale;
z0 = repmat(x, N, 1) + (sqrt(-1) * repmat(x', 1, N));


disp('iterating...');
for i=1:N
    for j=1:N
        z = z0(i, j);
        counter=0;
        while abs(z)<blowup && counter < maxiter
            z = z^2 + c;
            counter = counter + 1;
        end
        F(i, j) = counter;
    end
end

disp('plotting...');
figure(1); imagesc(F); axis image;


disp('done')
initiializing variables...

c =

   0.2850 + 0.0100i

iterating...
plotting...
done
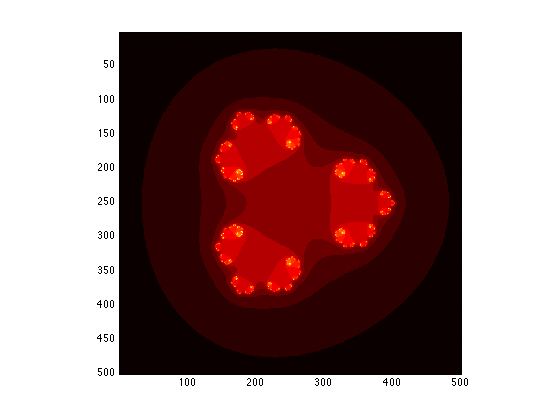
2.7
Make your own fractal! you can change the value for c, or pick a different function instead of z = z^2 + c, also try picking a colormap that is different then the default one... pick a setup that you find interesting and calculate it and plot it below
disp('initiializing variables...');
N = 500;
maxiter = 200;
blowup = 200;
scale = 2;

F = zeros(N, N);

%c = rand + rand*sqrt(-1);
c= 1- (1 + sqrt(5))/2;


x = -scale:(2*scale/(N-1)):scale;
z0 = repmat(x, N, 1) + (sqrt(-1) * repmat(x', 1, N));


disp('iterating...');
for i=1:N
    for j=1:N
        z = z0(i, j);
        counter=0;
        while abs(z)<blowup && counter < maxiter
            z = z^3 + c;
            counter = counter + 1;
        end
        F(i, j) = counter;
    end
end

disp('plotting...');
colormap('hot');
figure(1); imagesc(F); axis image;


disp('done')
initiializing variables...
iterating...
plotting...
done