Compressive Structured Light for Recovering Inhomogeneous Participating Media |
 | |
Structured light has a long history in the computer vision community. It has
matured into a robust and efficient method for recovering the surfaces of
objects. By projecting coded light patterns on the scene, and observing it
using a camera, correspondences are established and the 3D structure of the
scene is recovered by triangulation. Over the years, researchers have developed
various types of coding strategies. All structured light range finding
approaches are based on a common assumption: Each point in the camera image
receives light reflected from a single surface point in the scene.
However, many real-world phenomena can only be described by volume densities
rather than boundary surfaces. Such phenomena are often referred to as
participating media. Examples include translucent objects, smoke, clouds,
mixing fluids, and biological tissues. Consider an image acquired by
photographing a volume of a participating medium. Unlike in the case of an
opaque object, here each pixel receives scattered light from all points along
the line of sight within the volume. In this project, we propose a new
method named compressive structured light for recovering inhomogeneous
participating media. Whereas conventional structured light methods emit coded
light patterns onto the surface of an opaque object to establish
correspondence, compressive structured light projects patterns into a volume of
participating medium to produce images which are integral measurements of the
volume density along the line of sight. For a typical participating medium
encountered in the real world, the integral nature of the acquired images
enables the use of compressive sensing techniques that can recover the entire
volume density from only a few measurements. This makes the acquisition process
more efficient and enables reconstruction of dynamic volumetric phenomena. We
show the effectiveness of our method with simulations as well as experiments on
the volumetric recovery of multiple translucent layers, 3D point clouds etched
in glass, and the dynamic process of milk drops dissolving in water.
This project is done in collaboration with Eitan Grinspun, Peter Belhumeur, and Ravi Ramamoorthi at Columbia
University. |
Publications
"Compressive Structured Light for Recovering Inhomogeneous Participating Media,"
J. Gu, S. K. Nayar, E. Grinspun, P. N. Belhumeur and R. Ramamoorthi,
European Conference on Computer Vision (ECCV),
Oct. 2008.
[PDF] [bib] [©]
|
Images
 |
|
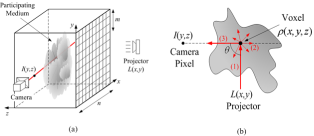
Formulation:
Diagram (a) shows the formulation of compressive structured light for
recovering inhomogeneous participating media. Coded light is emitted along the
z-axis to the volume while the camera acquires images as line-integrated
measurements of the volume density along the x-axis. (b) shows the image
formation model for participating medium under single scattering.
|
| |
|
|
 |
|
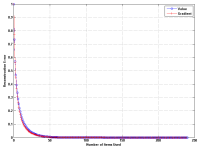
Sparsity of the Volumetric Data:
Here we show the sparsity of one type of participating media we often
encounter in the real world -- smoke. The volumetric data is acquired by T.
Hawkins, et al. [3]. We obtained 120 volumes, each of which is of size
240x240x62. We consider each row of a volume as an individual 1D signal (of
length 240). This plot shows the average reconstruction errors versus the
number of elements we used for reconstruction. The two curves correspond to the
reconstruction errors when the signal is represented as signal value or signal
gradient, respectively.
|
| |
|
|
 |
|
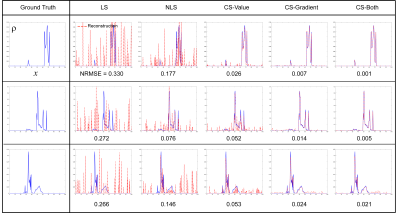
Comparison of different reconstruction methods on 1D curves:
This plot shows the results on the 1D signals of the above smoke data. The
first column is the original signal. The remaining columns show reconstruction
results (red dashed lines) for different methods, given the measurement cost,
m/n, is equal to 1/4 (where m is the number of measurements and n is the number
of unknowns). The value below each plot is the NRMSE(normalized root mean
squared error) of reconstruction.
|
| |
|
|
 |
|
Coded Light Pattern:
In our experiment, we use the vertical binary stripe patterns as the coded light pattern. Each frame has 128 stripes. The stripes are randomly assigned to be 0 (black) or 1 (white) according to Bernoulli distribution (with p=0.5). We also tried Hadamard codes and found that the Bernoulli random code is better.
|
| |
|
|
 |
|
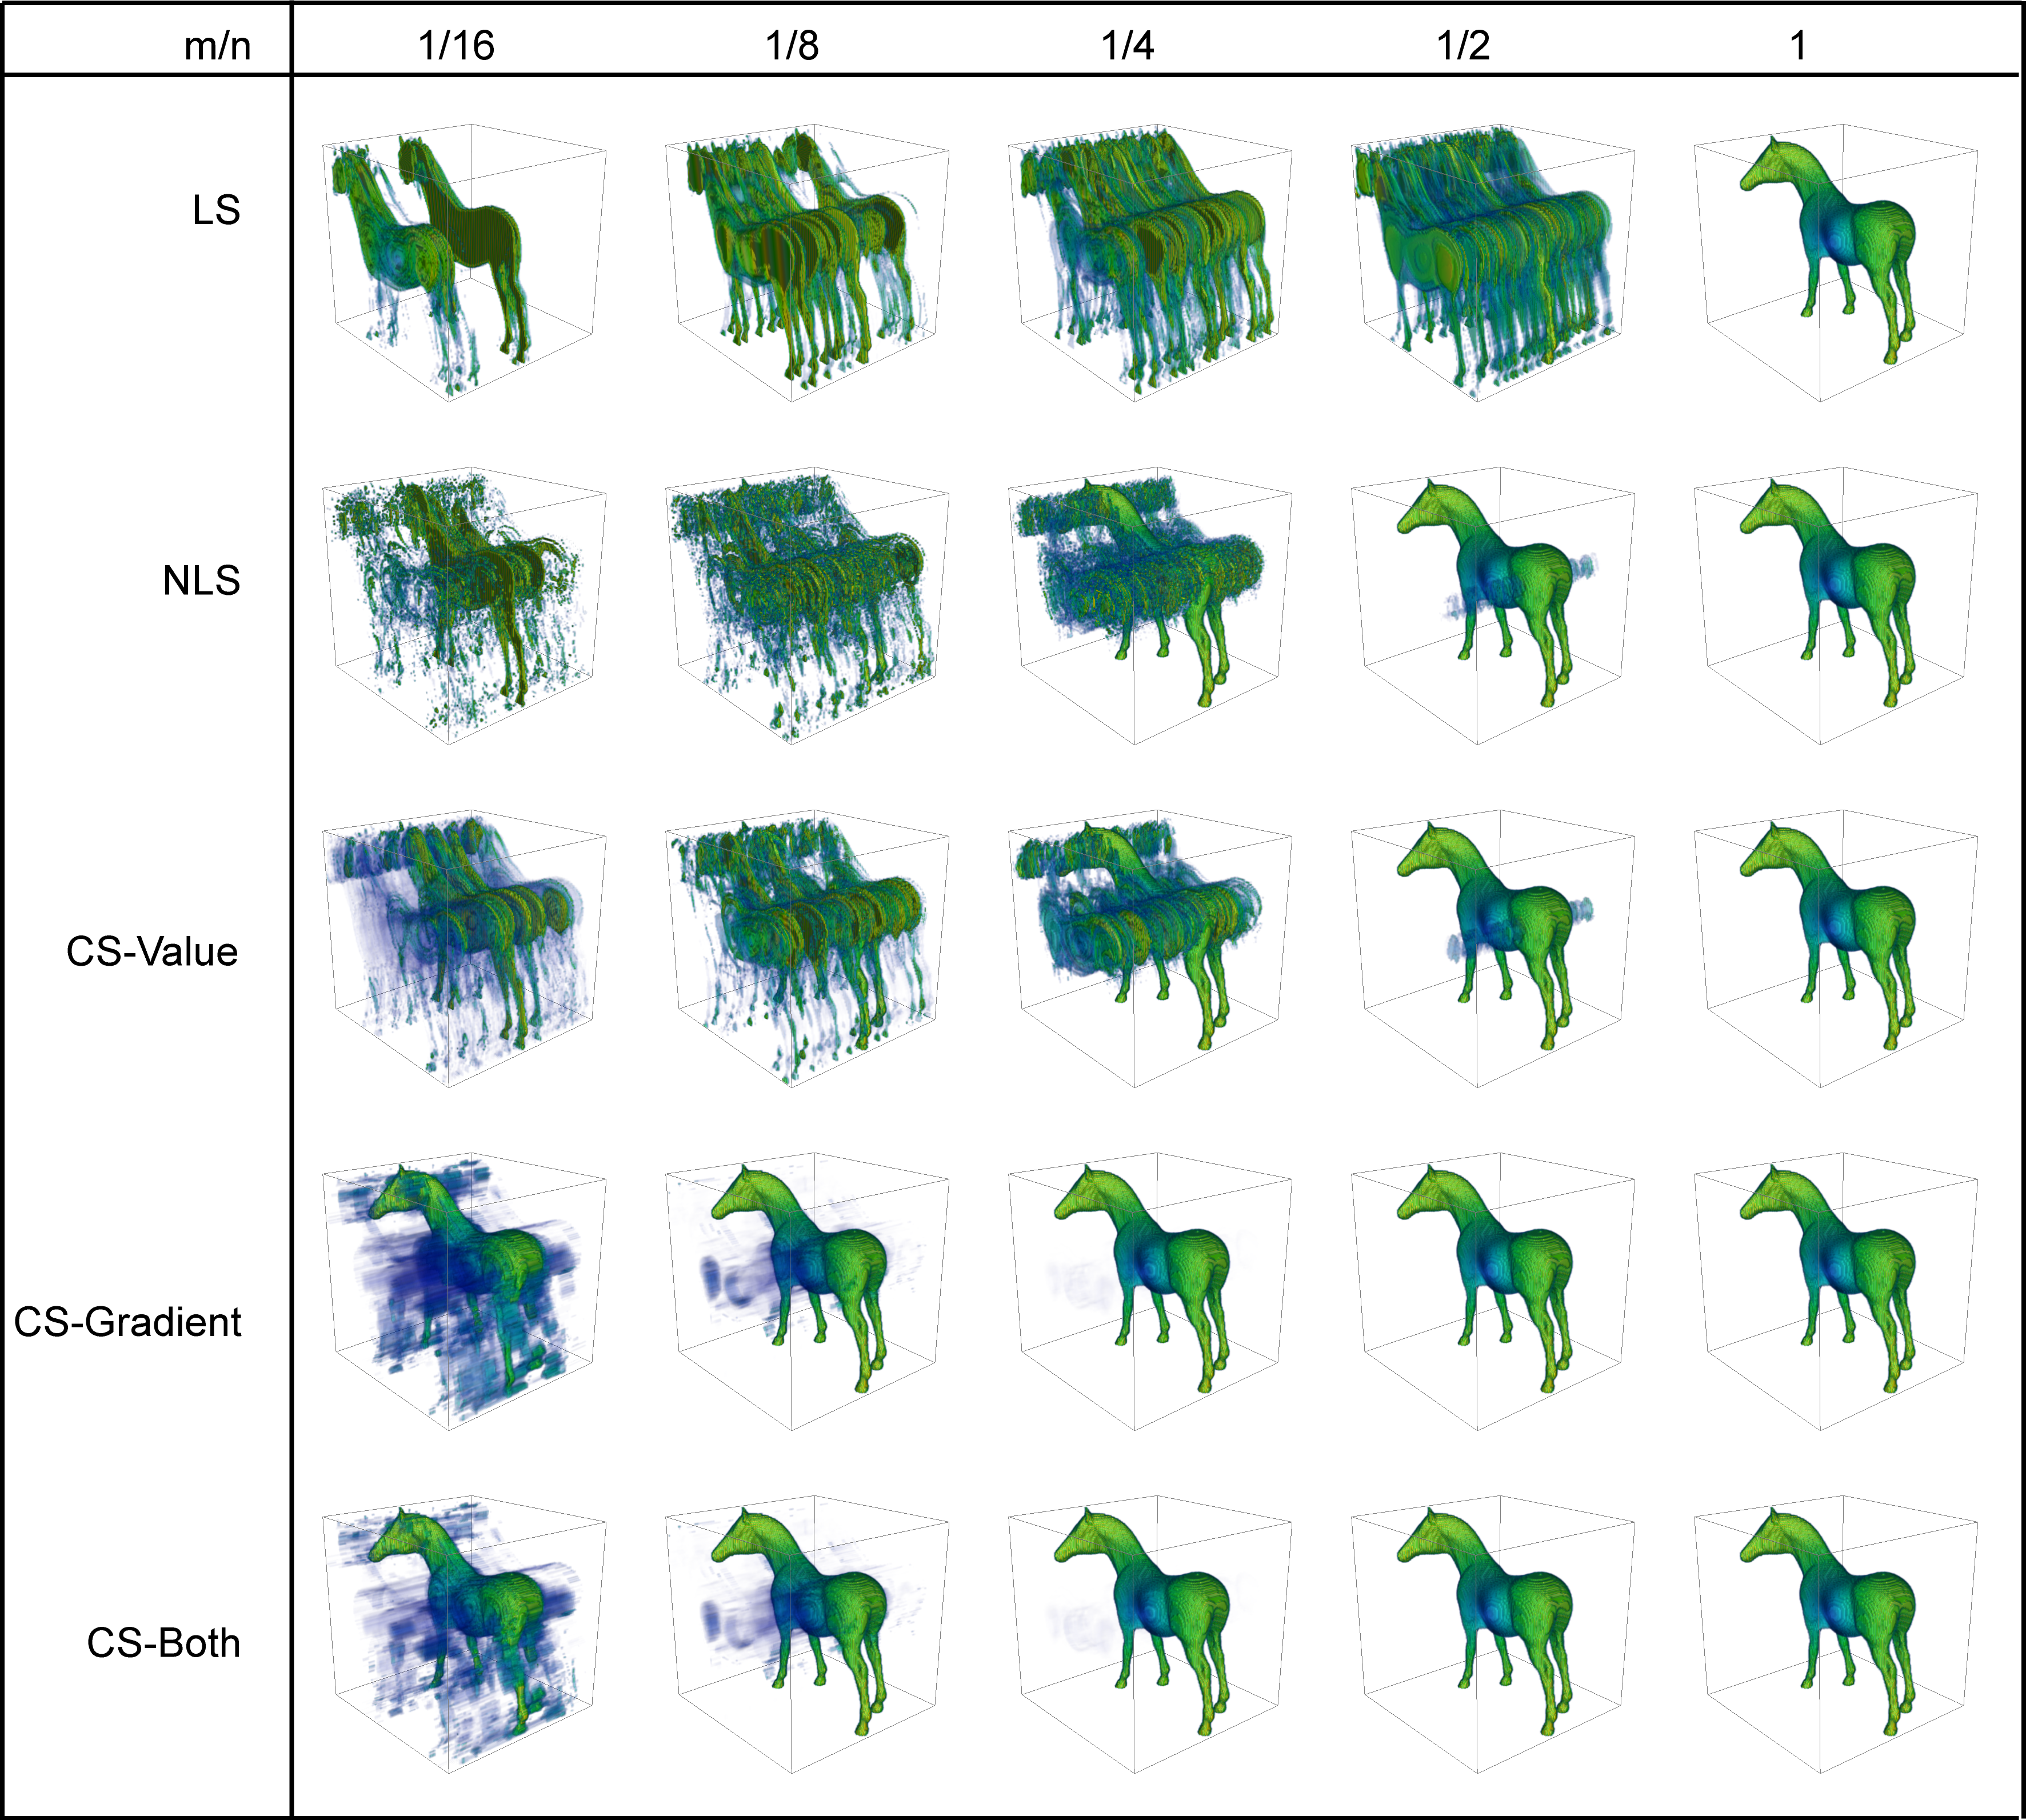
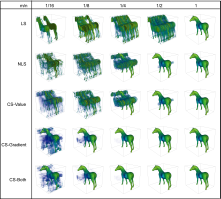
Simulation Results
of Volume Reconstruction:
This figure shows 3D simulation results of
volume reconstruction with the proposed method. The original volume is
a horse where blue means the lowest density and yellow means the
highest density. The figure shows the reconstruction results of several
methods under different measurement costs, m/n, where m is the number
of measurements and n is the number of unknowns. It shows that
CS-Gradient and CS-Both can obtain fairly good reconstruction even when
m/n is as low as 1/8.
|
| |
|
|
 |
|
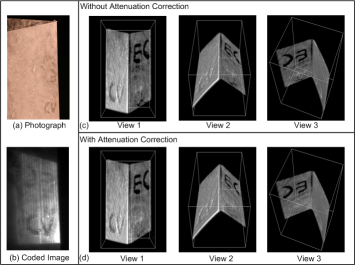
Experimental Results of The Two-Plane Example:
Here the figure shows the reconstruction results for the two-plane example
using our system. The two planes, formed as a 'V' shape, are covered with
powder (except in the regions of the letters 'EC' on the back plane and the
letters 'CV' on the frontal plane) to create a simple volumetric example. (a)
shows the original photograph, (b) shows one of the 24 measurements, and (c)(d)
shows the reconstructed volumes under different views, with and without
attenuation correction.
|
| |
|
|
 |
|
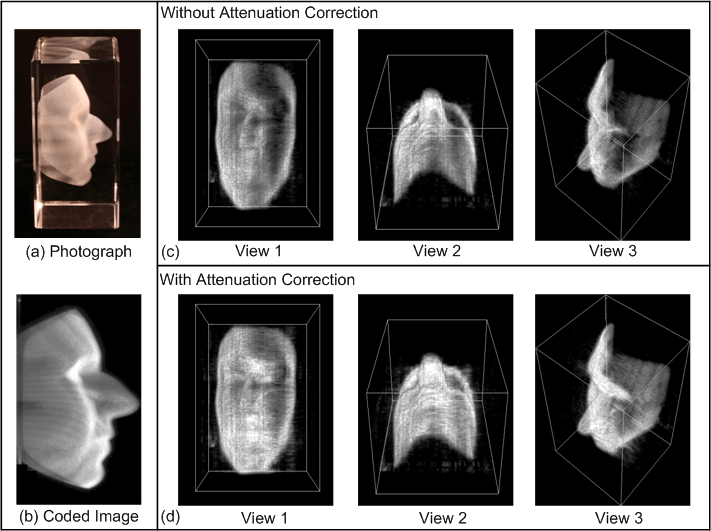
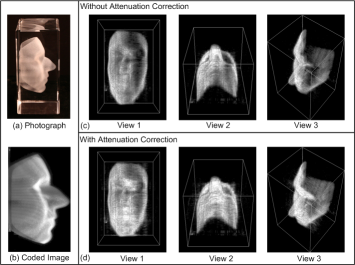
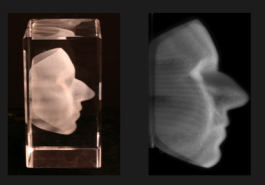
Experimental Results of The Face-Point-Cloud Example:
Similar to the two-plane example, this figure shows the reconstruction results
for the face example where a 3D point cloud are etched in a glass cube to form
a face. (a) shows the original photograph, (b) shows one of the 24
measurements, and (c)(d) shows the reconstructed volumes under different views,
with and without attenuation correction.
|
| |
|
|
 |
|
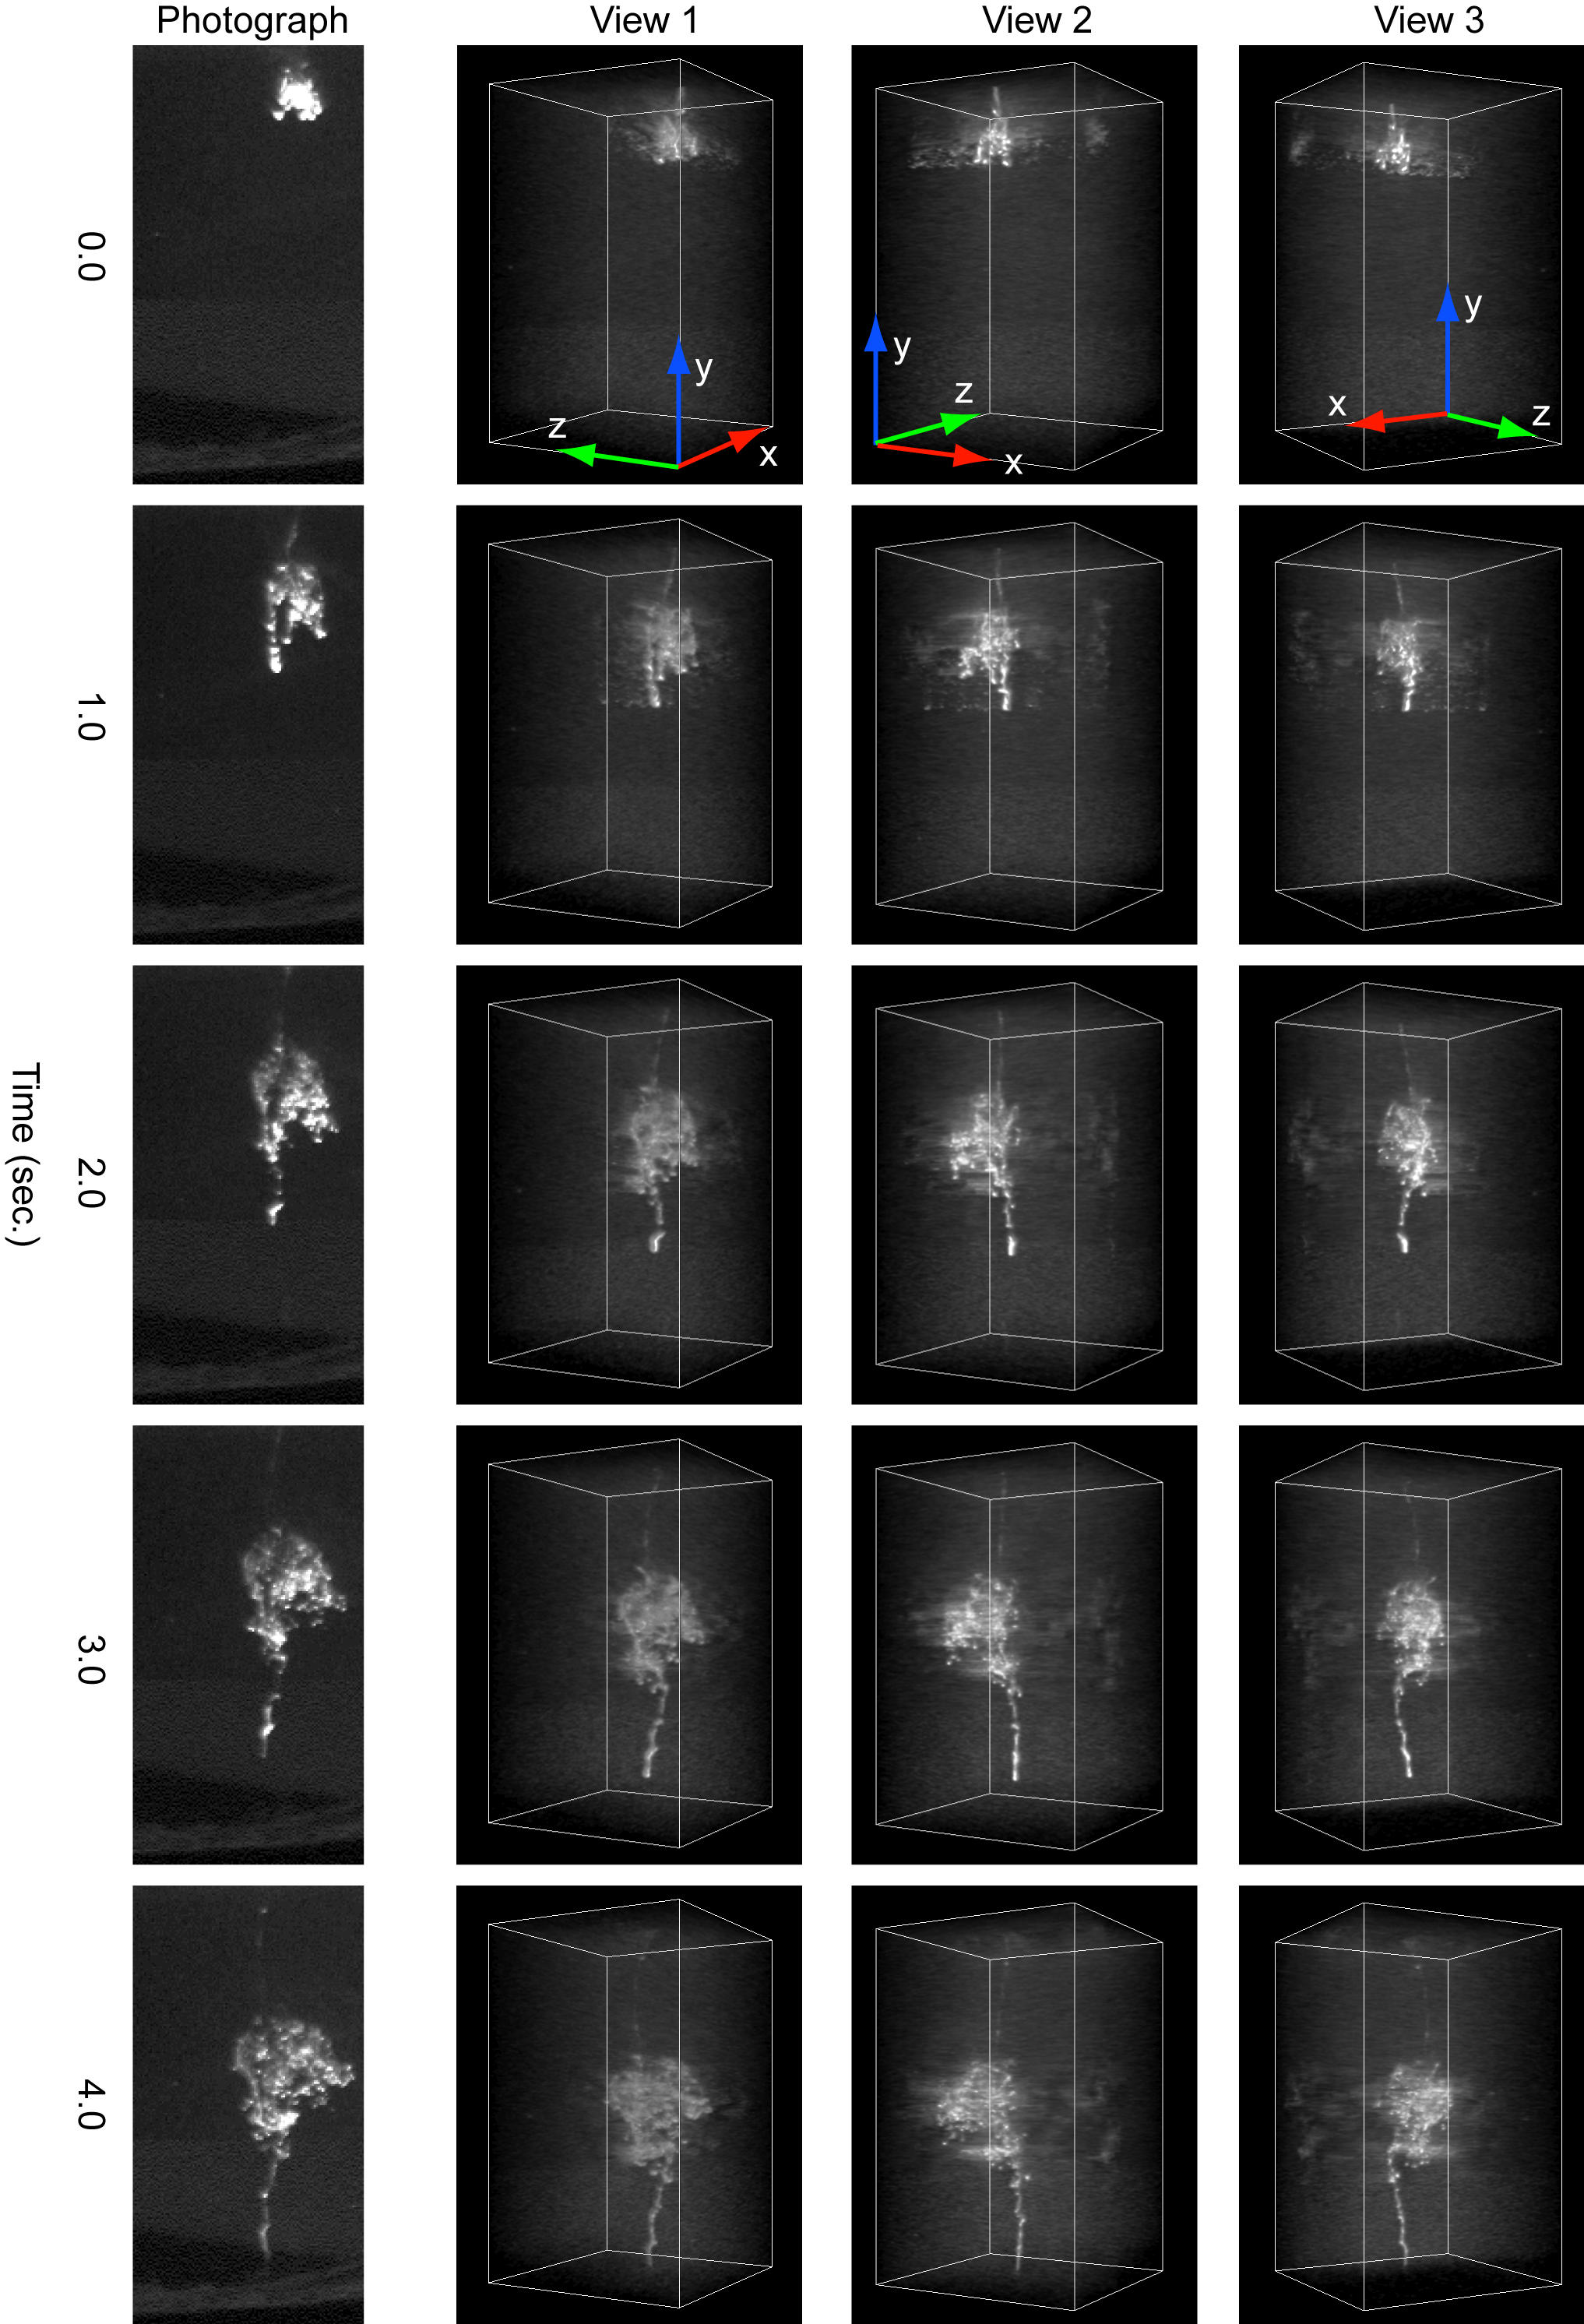
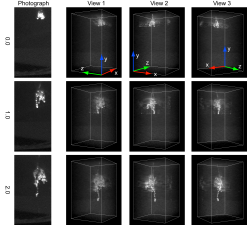
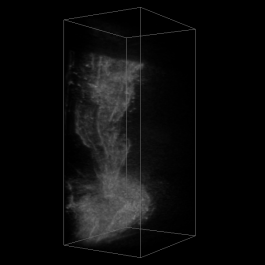
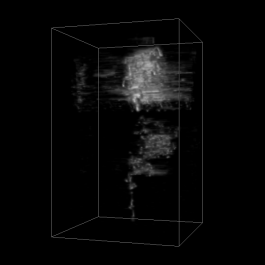
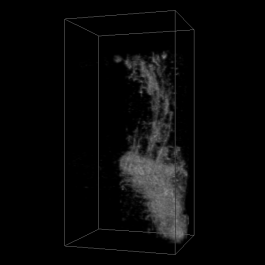
Experimental Results of A Sequence of Milk Clouds:
Exploiting the sparsity in signal reconstruction gives us higher efficiency in
acquisition. This enables us to acquire time-varying volumetric data using our
current setup. This figure shows the reconstruction results of a sequence of
milk drops dissolving in a water tank at different times. The results are shown
at 3 different views. The left-most column shows the original video frames at
the corresponding moments.
|
| |
|
|
|
Videos
 |
|
ECCV 2008 Video:
This video introduces the formulation and setup for the compressive structured light method
and demonstrates several simulation results as well as experimental results for reconstructing
various types of inhomogeneous participating media. (Without narration)
|
| |
|
|
 |
|
Milk Cloud at One Time Instance:
This video shows the reconstructed 3D volume density of the milk cloud at one time instance. The volume resolution is 128*128*250. It is reconstructed from 24 images measured with the coded light patterns.
|
| |
|
|
 |
|
Milk Dissolving in Water:
This video shows the dynamic of milk dissolving in a water tank. The left is the recorded video from the camera, and the right shows the corresponding reconstructed 3D volume density from different views. Thanks to the high efficiency in our acquisition system, we can reconstruct the dynamic volumetric phenomena up to 15fps with the volume resolution 128*128*250.
|
| |
|
|
 |
|
Milk Dissolving in Water:
This video shows another sequence of the dynamic of milk dissolving in a water tank.
|
| |
|
|
 |
|
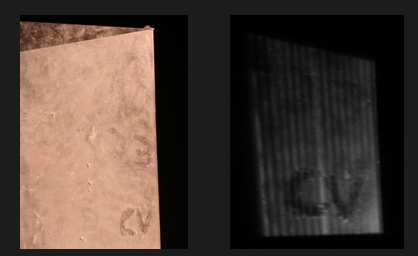
A Volume of Two Planes:
This video shows the reconstructed volume density of two glass planes. The two planes, formed as a 'V' shape, are covered with powder (except in the regions of the letters 'EC' on the back plane and the letters 'CV' on the frontal plane) to create a simple volumetric example. The image shows an photograph of the two planes and one of the measured images.
|
| |
|
|
 |
|
A Volume of A Face:
This video shows the reconstructed volume density of a 3D point cloud of a face etched in a glass cube. The image shows an photograph of the two planes and one of the measured images.
|
| |
|
|
|
Slides
ECCV 2008 presentation With videos (zip file)
|
Software
Data and Matlab Code for Simulation Here (584K) are the volume data for the horse example and some matlab code
to generate the simulation results (similar as Fig.5 in the paper). Note that
instead of GLPK, for the simple
1-D L-1 norm optimization, the matlab function linprog is sufficient (so, no
need to handle the interface between matlab and C). I also put in the matlab file
to read/write VTK file, written by Erik. After
unzipping the file, in Matlab type >>run_demo You will need to write your
own code to visualize the volume, either in matlab, or using VTK.
|
Compressive Sensing Resources
Multiplexed Illumination
Structured Light in Scattering Media
Participating Media: Single Scattering Model
Participating Media: Multiple Scattering Model
|
|
|